CLICK HERE TO GO TO THE VIRTUAL LAB FOR PART 1
Part 1 - Testing "Which colors of the light spectrum are most important for plant growth?"
In this lab you will perform an experiment to investigate what colors of light cause the most plant growth. You will calculate the plant growth by measuring the height of each plant under different colors of light. You will then compare these measurements and create a graph to determine which colors of the spectrum plants use the best.
Follow these steps for the spinach seeds first, then repeat the same procedures for radish and lettuce to complete your data table.
#1 - make two hypotheses by circling the color you think will work best and worst.
#2 - follow this step by step guide. Remember to reuse these steps for the other types of seeds.
Here you see the starting screen. Read through the material in the white left hand column, scroll down to keep reading till you reach Procedures.
SPECIAL NOTE - HOW TO GET THE AVERAGES FOR YOUR DATA TABLE:
Add up the heights of the three plants under one color in your table. Divide that total by 3. That's the average.
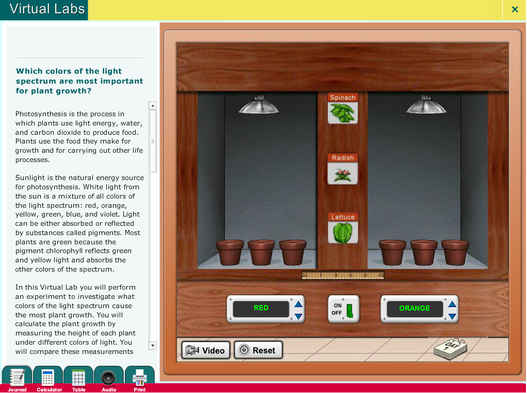
1. Your first step is to choose the plant seed type to test. Choose spinach for the first tests.
SPECIAL NOTE - HOW TO GET THE AVERAGES FOR YOUR DATA TABLE:
Add up the heights of the three plants under one color in your table. Divide that total by 3. That's the average.
1. Your first step is to choose the plant seed type to test. Choose spinach for the first tests.
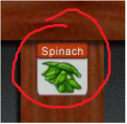
2. Use the arrows to set the color of light, use a different color on each side to get results faster.
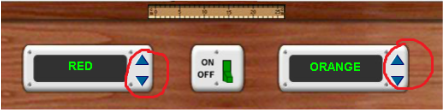
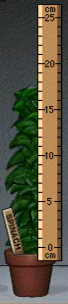
3. Turn on the light, then grab the ruler and slide it to each plant to measure plant growth. Record the measurements in the table
|
|
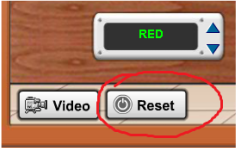
4. Hit reset, pick the same plant seeds, and try again with 2 different colors, repeat until you’ve tested all colors with that ONE type of seed. It will take 3 rounds of color changes with measuring.
5. Repeat these steps using radish seeds with all 5 colors, then lettuce seeds with all 5 colors.
Part 1 is complete! (we will however graph this data later)
| photolab.swf |
**** If this website below doesn't work, download the file above called photolab.swf Then right click on the file and use internet explorer to run it.
CLICK HERE TO GO TO THE VIRTUAL LAB FOR PART 2
*** NOTE *** If the simulation does not work, try switching browsers to internet explorer or microsoft edge. Allow the site to run Flash if it asks.
Part 2 -
Testing Question 1 - "How does the brightness (intensity) of light effect plant growth?"
Testing Question 2 - "How does the amount of carbon dioxide available effect plant growth?"
Testing Question 3 - "How does temperature effect plant growth?"
1. Propose hypotheses by completing a, b, and c.
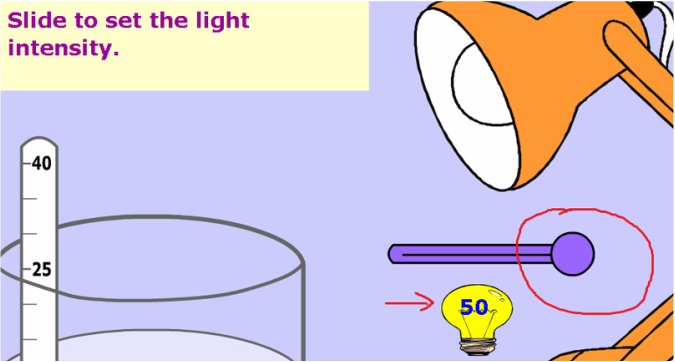
The first thing you will test is Light Intensity - how bright a light is.
IMPORTANT NOTE - HOW TO TAKE MEASUREMENTS IN THIS VIRTUAL LAB
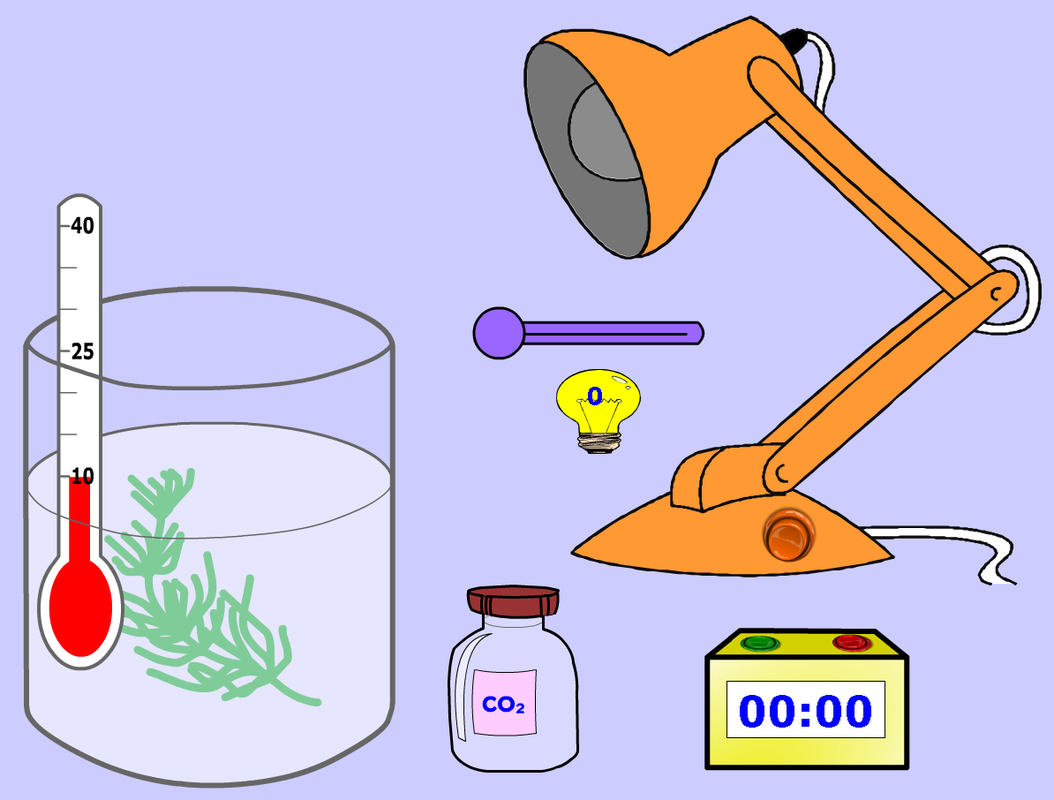
Each thing you test in this virtual lab will change the speed of bubbles produced. The bubbles are produced when water plants perform photosynthesis. Oxygen is created and you can see the plant "breathe it out" as tiny bubbles.
The bubbles will be coming from the bottom of the stem.
Your job is to count how many bubbles are produced for each test for 30 seconds. That is what you want to record on your paper.
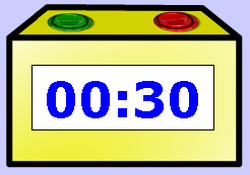
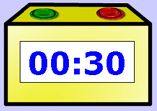
Use the green button to start the clock. If you press the green button again it will pause.
Use the red button to reset the clock. To stop the clock you must pause it with the green button.
Use the red button to reset the clock. To stop the clock you must pause it with the green button.
Question 1 - How Does Light Intensity Affect the Rate of Photosynthesis
1. Set the light intensity to 0 and count the number of bubbles produced over 30 seconds using the clock.
2. Set the light intensity to the next value on your table and count the number of bubbles produced over 30 seconds using the clock.
3. Repeat until you've tried each intensity.
1. Set the light intensity to 0 and count the number of bubbles produced over 30 seconds using the clock.
2. Set the light intensity to the next value on your table and count the number of bubbles produced over 30 seconds using the clock.
3. Repeat until you've tried each intensity.

|
|
4. Use your data to answer A, B, and C
Question 2 - How Does Carbon Dioxide Affect the Rate of Photosynthesis?
1. Set the light intensity to 50. The CO2 bottle should look full.
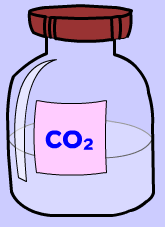
2. Count how many bubbles are produced in 30 seconds. Record that number in the HALF CO2 table. The right hand box.

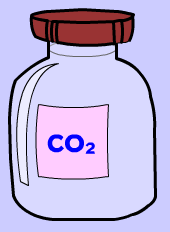
Now you will change how much carbon dioxide is dissolved in the water.
Click on the bottle of CO2 and it will appear half empty - you've added CO2 to the water.
3. Count how many bubbles are produced in 30 seconds. Record that number in the FULL CO2 table. The left hand box.
4. Write a conclusion in a complete sentence that answers Question 2.
Question 3 - How Does Temperature Affect the Rate of Photosynthesis?
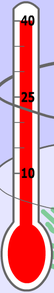
1. Create a table in the space provided to record the Number of Bubbles produced over 30 seconds at 3 different temperatures - 10, 25, and 40 degrees Celsius (about 50, 77, and 104 degrees Fahrenheit) It should look similar to Question 2's table.

|

|

|

|
|
2. Click the CO2 bottle again to make it appear full. Set the light intensity to 50.
3. Record the number of bubbles produced over 30 seconds for each temperature setting. in the table you created.
4. Use your data to write a conclusion that answers Question 3. This should be in a complete sentence.
Part 2 is complete! (we will however graph this data later)
3. Record the number of bubbles produced over 30 seconds for each temperature setting. in the table you created.
4. Use your data to write a conclusion that answers Question 3. This should be in a complete sentence.
Part 2 is complete! (we will however graph this data later)
